
Flags every testSCORE 0
It catches every real flaw, but flags every safe test too.
Real flaws
Safe code
- Caught
- 100%
- Flagged
- 100%
- Score
- 0
See how Goosy holds up on the industry's standard test. We ran Deep Scan against OWASP Benchmark v1.2, measuring what it catches, what it misses, and what it flags by mistake.
Overview
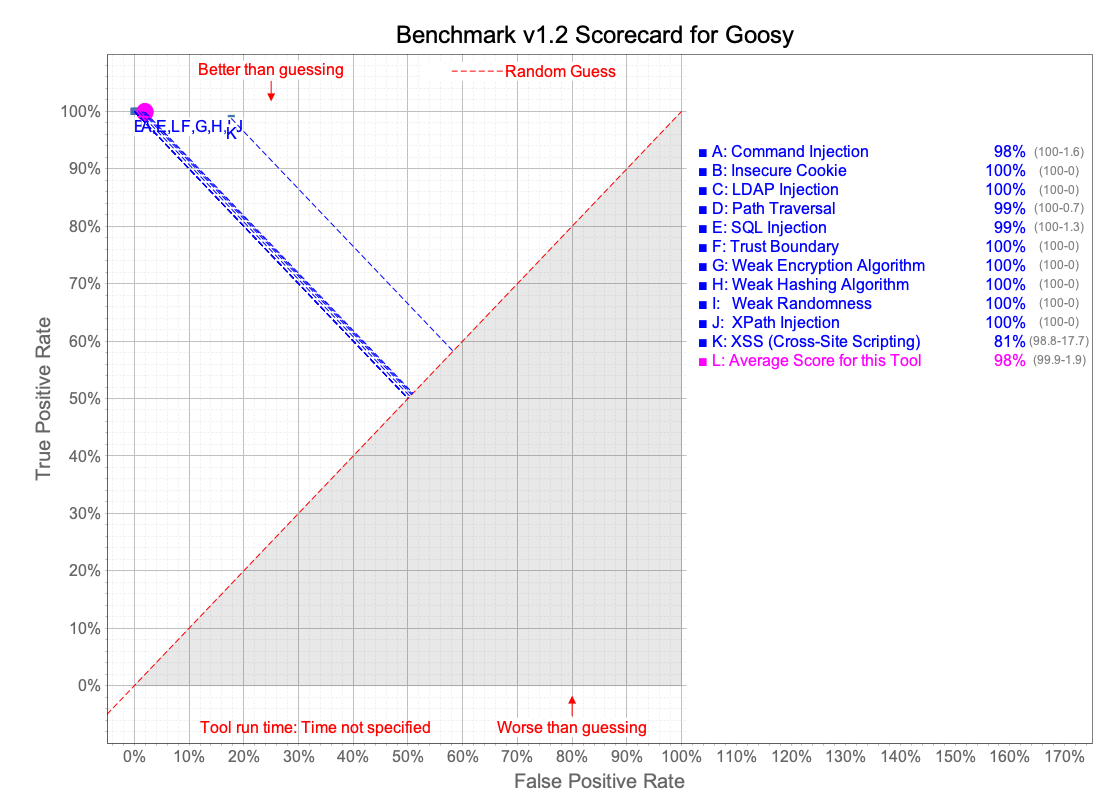
Built for accuracy. Goosy scored 97.95 out of 100 on OWASP Benchmark Java v1.2. 7 categories scored a perfect 100, 3 more scored above 98, and cross-site scripting is the one to improve.
Score card
Every category, plotted by how many real flaws Goosy caught against how much safe code it flagged by mistake. The chart is generated by the OWASP Benchmark scorecard tooling and shown exactly as produced.
How to read it
| A | Command Injection | 98.4% | (100-1.6) |
| B | Insecure Cookie | 100.0% | (100-0) |
| C | LDAP Injection | 100.0% | (100-0) |
| D | Path Traversal | 99.3% | (100-0.7) |
| E | SQL Injection | 98.7% | (100-1.3) |
| F | Trust Boundary | 100.0% | (100-0) |
| G | Weak Encryption Algorithm | 100.0% | (100-0) |
| H | Weak Hashing Algorithm | 100.0% | (100-0) |
| I | Weak Randomness | 100.0% | (100-0) |
| J | XPath Injection | 100.0% | (100-0) |
| K | XSS (Cross-Site Scripting) | 81.1% | (98.8-17.7) |
| L | Average score for this tool | 97.95% | (99.9-1.9) |
Category breakdown
The official score is an average across vulnerability categories. Select one to see how Goosy performed and what that class of flaw is.
Untrusted input is concatenated into a database query.
98.71Score
Real flaws272 of 272 caught
True positive rate 100.00%
Safe code229 of 232 left alone
False positive rate 1.29% · 3 flagged by mistake
Methodology
The OWASP Benchmark Accuracy Score measures how accurately an application security testing (AST) tool detects real vulnerabilities while avoiding false alarms.
The key idea
A tool that flags every test case might catch all the real vulnerabilities, but it would also generate many false positives. OWASP Benchmark therefore evaluates both detection capability and false-alarm rate.
Its scoring method is based on Youden's Index, a statistical measure used to evaluate diagnostic tests.
It catches every real flaw, but flags every safe test too.
Real flaws
Safe code
It never raises a false alarm, but misses every real flaw.
Real flaws
Safe code
It catches every real flaw and stays quiet on safe code.
Real flaws
Safe code
Illustrative: each card shows 20 example tests, 10 real flaws and 10 safe ones.
01 · Outcomes
Every test case in the benchmark has an expected result. The tool's output is compared against that expected result to classify its performance.
1,412In this run
The test contains a real vulnerability, and the tool reports it.
Example
Detects a genuinely exploitable SQL injection.
3In this run
The test contains a real vulnerability, but the tool misses it.
Example
Fails to report an exploitable SQL injection.
43In this run
The test is not vulnerable, but the tool reports a vulnerability.
Example
Flags a safe input-handling pattern as exploitable.
1,282In this run
The test is not vulnerable, and the tool correctly does not report a vulnerability.
Example
Correctly ignores a safe SQL query.
These outcomes form the confusion matrix used to calculate the Benchmark score.
02 · Formulas
The scoring process first calculates two rates: the True Positive Rate and the False Positive Rate.
TPR measures how many genuine vulnerabilities the tool successfully detects.
Example
Suppose a benchmark category contains 100 genuinely vulnerable test cases. The scanner detects 90 and misses 10.
A higher TPR means fewer missed vulnerabilities.
FPR measures the proportion of non-vulnerable test cases that the scanner incorrectly flags.
Example
Suppose there are 100 non-vulnerable test cases, of which the scanner incorrectly flags 15 and correctly ignores 85.
A lower FPR means fewer false alarms.
Both formulas are explicitly specified in the OWASP Benchmark scoring documentation.OWASP Benchmark project ↗
C · Benchmark accuracy score
Score = 100 (TPR − FPR)
Using the two examples above: 100 × (0.90 − 0.15) = 75
Equivalently, the score in the range −100 to 100 is the normalized difference between the two rates, where 100 is ideal, 0 is equivalent to the random-guessing baseline, and a negative result indicates performance below that baseline. The OWASP documentation commonly describes the 0–100 range for scores at or above the baseline.
Goosy 071dee30 (in the shipping product), scored with OWASP's own scorecard tool on 2026-09-21. This is run 2 of two identical runs (97.73 and 97.95; mean 97.84). Detector tuning was chosen by studying this benchmark's own false positives, so the score likely overstates performance on code Deep Scan has not seen.